Restaurant toolkit
 1min
1min
24 November 2025

Running a successful eatery in the UK requires a fusion of culinary passion, operational know-how, and a deep understanding of your guests’ desires. Perhaps you have the most tantalising specials and a dedicated team in your kitchen—yet without precise insights into your business performance, making impactful decisions can be more of a guessing game than a strategic plan.
That’s where restaurant metrics enter the picture. Gathering hard data about your operations—whether it’s your average transaction value or your digital reputation—enables you to focus your efforts where they matter most. It’s the difference between lobbing salt into a dish at random and taste-testing meticulously. In a world where diners expect prompt service, user-friendly payment experiences, and consistent quality, tracking and fine-tuning specific indicators is critical for staying ahead.
Below, we delve into five metrics that every UK-based operator should be monitoring. These are the building blocks for stronger guest satisfaction, improved margins, and a clearer business strategy.
Every restaurant visit results in an invoice, which is made up of individual items (main courses, drinks, and extras). Average Transaction Value tracks the typical amount guests spend per bill. Monitoring this can reveal a host of insights into your menu, pricing strategy, and even the effectiveness of your staff’s upselling techniques.
When you know how much an average order is worth, you can identify not only the best-selling menu items but also opportunities to boost profitability. For instance, you might conclude that diners typically spend £18 per visit during the week but £23 at weekends. That insight alone can help you tailor your weekday promotions or craft weekend deals more effectively.
You can also see how changes in your menu lead to changes in the ATV. If you launch a new range of sharing platters and see your average spend rise, that’s a sign it’s resonating with guests. Or if your introduction of a pricier premium option doesn’t influence your overall ATV, it might need rethinking—or more involvement from your front-of-house team, so they can suggest it to diners. This metric is about fine-tuning the balance between profitability and satisfying your customers’ tastes.
Most modern POS systems can calculate the average transaction value automatically. Otherwise, dividing your total revenue by the number of orders over a set period is a straightforward calculation. Over time, it’s wise to split your ATV data:
An even more granular approach includes segmenting your audience by diner profile—families, couples, large groups—if you have the tools to do so. These deeper insights help you refine “specials, combos, or promotions” more precisely.
As a restaurant owner in the UK, every empty seat translates to potentially lost revenue. This is where your Table Turnover Rate (the number of parties served at each table within a given period) becomes vital. It directly affects how many dinners or lunches you can serve, which ties into everything from staffing needs to sales forecasting.
The more effectively you manage your table turnover, the more guests you’ll seat throughout the day. However, it’s critical to strike a balance between efficiency and hospitality. Quicker table turns can lead to more sales, but if diners feel rushed, your reputation could suffer—especially in a country with a well-rooted pub and restaurant culture, where a relaxed dining experience is often cherished.
Still, if your Turnover Rate is too slow, you risk not only lower revenue but also longer queues and potential negative reviews from those who feel let down by extended waiting times. This balancing act places the Turnover Rate squarely at the heart of the diner experience.
A few approaches can help cram less friction into your dining flow, without feeling pushy:
Remember: The objective isn’t to race your guests out the door but to keep each stage of the dining cycle flowing. Efficiency can be a form of hospitality when it’s done right, offering guests more control over their time while maximising your returns.
Staffing is among the highest expenses for restaurant operators—particularly in the UK, where living wage requirements, staff benefits, and training costs are all meaningful investments. Labour Cost Percentage (the ratio of labour costs to overall sales) helps clarify if you’re overstaffed, understaffed, or if you’ve struck the right balance to deliver high-quality service at a financially sustainable level.
The hospitality labour market can be challenging post-pandemic, with many restaurants facing talent shortages. Meanwhile, the UK imposes specific wage and pension contribution regulations. Factor in these obligations, and you’ll see how easily labour costs can eat into profits if you’re not paying attention.
Beyond compliance, you also want to ensure an optimal diner experience. Having staff available to greet guests, deliver orders promptly, and handle payments with minimal waiting fosters customer satisfaction. The trick is making sure you’re not paying for idle hands at off-peak times—nor leaving your restaurant short-staffed during heavy demand.
Most UK restaurant owners use a basic calculation:
| Labour Cost % | = (Total Labour Expense / Total Sales) x 100 |
This equation can be broken down by week, month, or quarter. You can further segment it by job type—for instance, front-of-house staff versus kitchen team. As a rule of thumb, many restaurant stakeholders aim to keep overall labour costs between 20% and 30% of sales, though exact targets vary based on your service style, concept, and local wages.
To refine your Labour Cost Percentage, assess staff schedules meticulously. Consider splitting shifts to cover mid-afternoon lulls, using part-time staff for peak hours, and training your team to handle multiple roles if possible. Integrating an employee scheduling tool with your POS system can give a clear view of staffing requirements versus real-time sales data, making labour cost adjustments more precise.
Spoiled produce is money down the drain. On the flip side, running out of key ingredients could cost you customers who show up excited for your famed fish and chips or an elegant Sunday roast. These scenarios illustrate why Inventory Turnover is the next pivotal metric for your UK restaurant.
Inventory Turnover measures how quickly you use (or sell) your stock. A relatively low turnover might indicate you’re over-ordering or not selling certain items as often as expected, leading to waste. A very high turnover might reveal you’re cutting it too close, risking shortages that frustrate your diners.
Given the UK’s often unpredictable weather patterns—scorching one day, drizzly the next—seasonal trends can significantly influence what’s popular. If you notice a spike in orders for iced beverages on the few particularly hot days of summer, your inventory strategy should flex accordingly.
The conventional formula is:
| Inventory Turnover | = Cost of Goods Sold / Average Inventory Value |
Tracking over a set period, like a month or quarter, is typical. Use the Cost of Goods Sold (often abbreviated as COGS) figure, which is the total cost of the products you sold. The average inventory value is your total inventory at the beginning of the period plus at the end of the period, divided by two.
One of the best ways to use this data effectively is to craft a more responsive ordering schedule. For instance, if you identify that a portion of your menu rarely sells, reduce or remove it to cut costs. Alternatively, highlight it in daily specials or promotions if you strongly believe in it. Adopting proactive inventory systems can help automate these insights, freeing you from the guesswork around re-stocking each day.
From TripAdvisor to Google Reviews, your guests have countless ways to share their experiences online. In the UK, prospective diners frequently check restaurant ratings before booking a table or placing an order. That’s why your Online Reputation Score—a general sense of your digital standing—can make or break your ability to draw in new customers.
It’s straightforward: high ratings and positive reviews drive more foot traffic. Conversely, a couple of prominent negative comments might be enough to steer many potential customers elsewhere. Even if you have a loyal local following, poor online reviews might deter travellers or first-time guests.
Beyond star ratings, you can glean deeper insights from the written feedback itself—information such as portion sizes, staff friendliness, or how quick and painless payments were. That, in turn, informs your service improvement strategies.
Your Online Reputation Score is effectively your digital word-of-mouth. Treat it with the same respect you’d give an in-person recommendation from a valued guest. Consistently tracking it gives you the knowledge to spot shifts—rapidly and accurately—and adapt.
Tracking each metric on its own provides value, but the magic happens when you combine them. Let’s consider an example scenario:
By triangulating these data points, you can hypothesise that the additional staff aren’t being deployed efficiently to speed up the dining cycle. Perhaps the bar is a bottleneck for pre-dinner cocktails, or your staff haven’t been properly trained on new menu items, causing delays. Studying and acting on these metrics in tandem can bring your operational performance back up to scratch.
As a UK-based operator, external factors such as changing consumer tastes, new food trends, or even local regulations can influence these numbers. That’s why building a dashboard—or adopting an integrated solution that helps you do so—can be immensely beneficial. This dashboard should display your top-line data at a glance, allowing you to spot fluctuations early and adjust your short-term or long-term strategies.
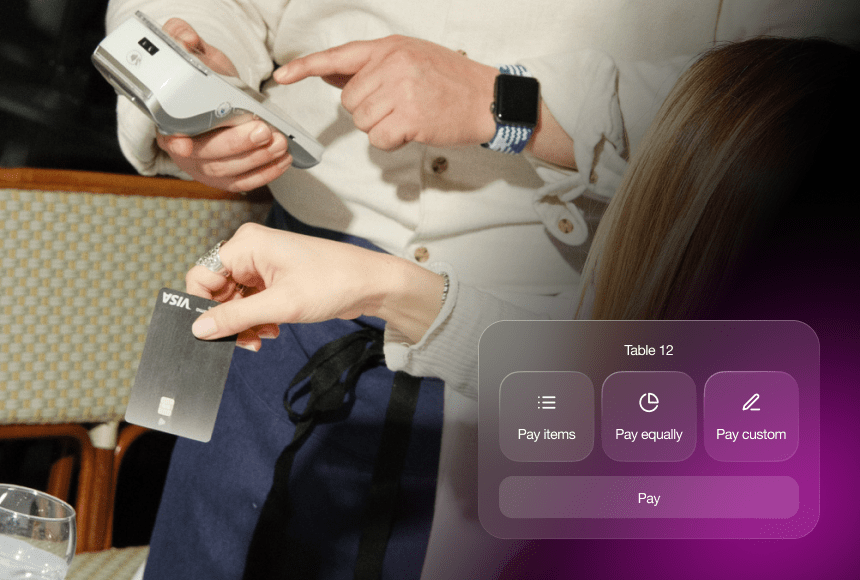
In the hustle of the restaurant world, technology shouldn’t get in the way of genuinely human service—it should enhance it. For instance, a QR-based payment solution, like the one offered by sunday, can reduce the time servers spend running back and forth to the table with multiple card machines. It can also encourage tipping and even nudge your patrons to leave a quick review whilst they’re already engaged with your restaurant’s digital payment interface.
Meanwhile, your chosen POS system can sync with your staff scheduling software, providing real-time updates on labour costs. Integrating with inventory management software can also help you monitor your daily or weekly inventory, automatically updating your cost of goods sold. Consider these connections your front-of-house—and back-of-house—assistant that never sleeps, delivering data-driven insights.
Let’s imagine a British gastropub called “The Old Oak & Crown.” By consistently tracking and fine-tuning the five metrics above, here’s what they accomplished:
This holistic approach emphasises that no single metric is a silver bullet. Success emerges when each piece of data complements the overall operational narrative, helping owners make clear-cut, confident decisions rooted in reality.
Between cost pressures from rising ingredients to staffing complexities, staying on top in today’s market is no small feat. Tracking these five essential metrics—Average Transaction Value, Table Turnover Rate, Labour Cost Percentage, Inventory Turnover, and Online Reputation Score—offers a structured approach to improvement.
The process is dynamic, not static. Your quest for better performance should never rest. Continual fine-tuning, open communication with your team, and regularly re-evaluating your approach assures that you’ll not only meet your targets but also keep pace with a fast-evolving hospitality sector.
While the data itself is crucial, the real value reveals itself when you interpret and act upon it. Each observation offers an opportunity to innovate—whether that’s creating new promotions, rethinking your ordering processes, or investing in user-friendly payment technology. Plus, engaging staff in this process often results in a more motivated, integrated team, ultimately benefiting your diners’ experience.
Monthly reviews are common, but for busier locations, weekly check-ins offer a more proactive stance. If your restaurant’s traffic is highly variable, like seaside or holiday hotspots, more frequent monitoring can help you react quickly to changing visitor volumes.
If you’re pressed for time or resources, begin with your Labour Cost Percentage, as staffing tends to be one of the largest ongoing expenses. Dialling in your labour schedule can free up funds to invest in other improvements, like a modern POS or marketing campaigns, which then helps you track additional metrics.
You can find general guidance on average UK cost percentages or recommended margins from associations like UKHospitality. Bear in mind, however, that each concept is unique. An upscale bistro in central London might target a different labour cost percentage than a quick-serve café in a smaller town.
It can. In a world where diners frequently check at least one review platform before booking, a single high-profile negative review could deter potential new customers. Responding quickly and courteously can sometimes transform a disgruntled guest into a loyal patron, showing that you value your customers’ experiences.
Begin with a reliable POS system that enables you to analyse real-time sales, then incorporate scheduling and inventory add-ons if your budget allows. If your current payment setup causes hold-ups during busy periods, adopting a solution like a QR-based payment system is a practical step to reduce friction and enhance the overall dining experience.
Drop us your details below and we’ll reach out within the next 24

sunday elevates your business with insightful data, instant feedback and precise analytics.